

Overview
Where supply is constrained and demand cannot relocate, value accrues to the owners of powered, operating capacity. The precedent is clear: Singapore's 2019 moratorium and Northern Virginia's power limits re-priced rents by 65-90%. Now, the same conditions are spreading. Moratoria, grid delays and community pushback are binding in the US, Australia and Japan, while interconnection and data sovereignty stop tier-one demand from leaking to cheaper locations. The beneficiaries are owners, not developers. NextDC (NXT) cut its FY27 EBITDA guidance by 36% on the same constraint that is lifting rents for incumbents.
The Precedent
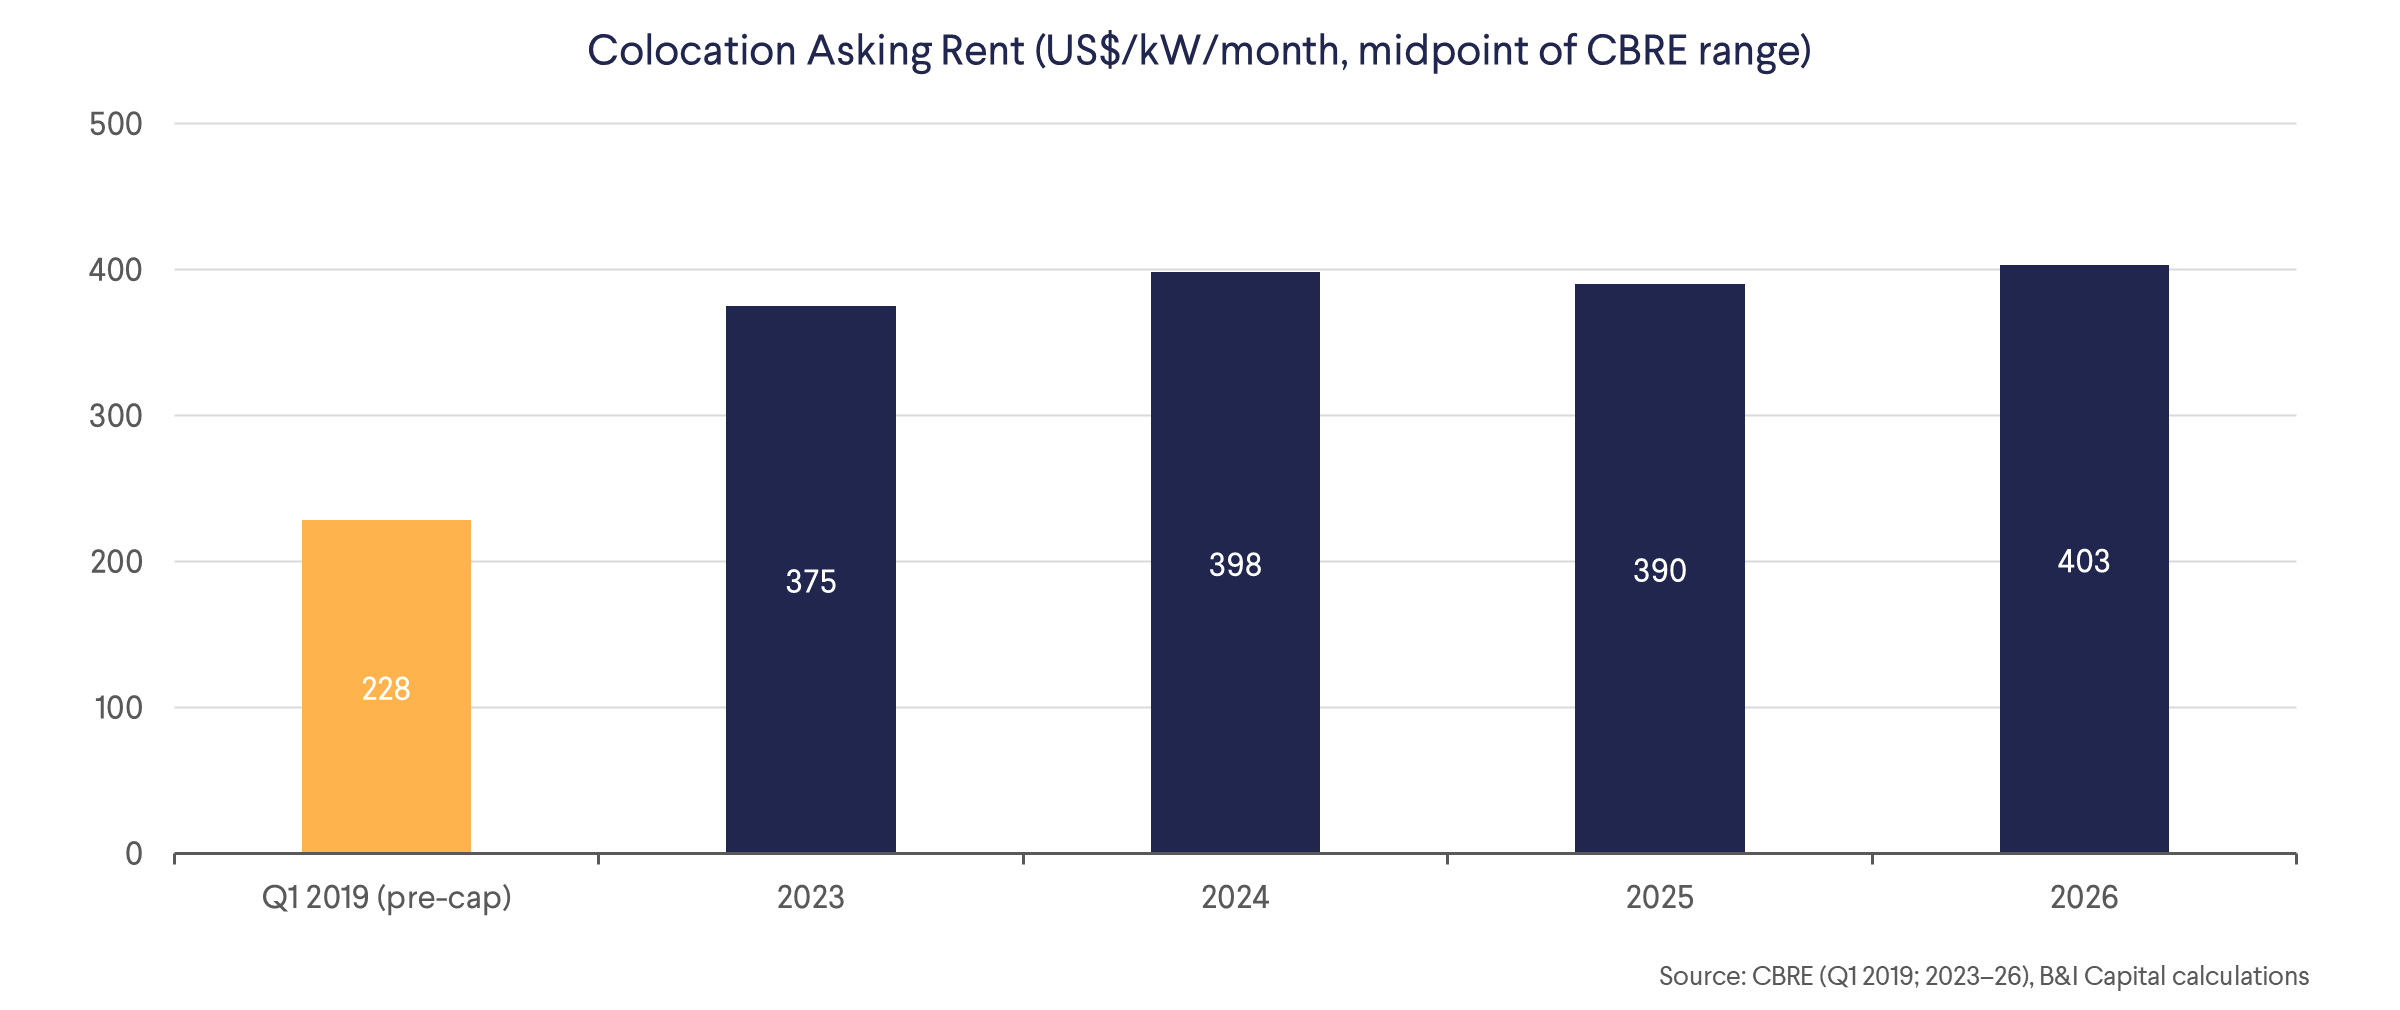
Singapore is the clearest case of a supply cap re-pricing rents. In 1Q19, the market had 360MW of stock and a 177MW pipeline, half as much again, and CBRE described it as a tenants' market. The 2019 moratorium cut the build rate from c.150MW a year to roughly 60MW. By 1H21 vacancy had fallen below 1% and the pipeline to 2023 was already pre-committed. Colocation asking rents rose from USD 228/kW/month pre-cap to USD 375 in 2023, a 65% increase, and reached USD 403 in 2026, 77% above the pre-moratorium level. The pattern is a step change, then a plateau, with rents growing c.2% a year since 2023. The premium has held rather than reversed. For context, unconstrained Sydney over the same period had ample new supply, with older facilities cutting rents to keep tenants.
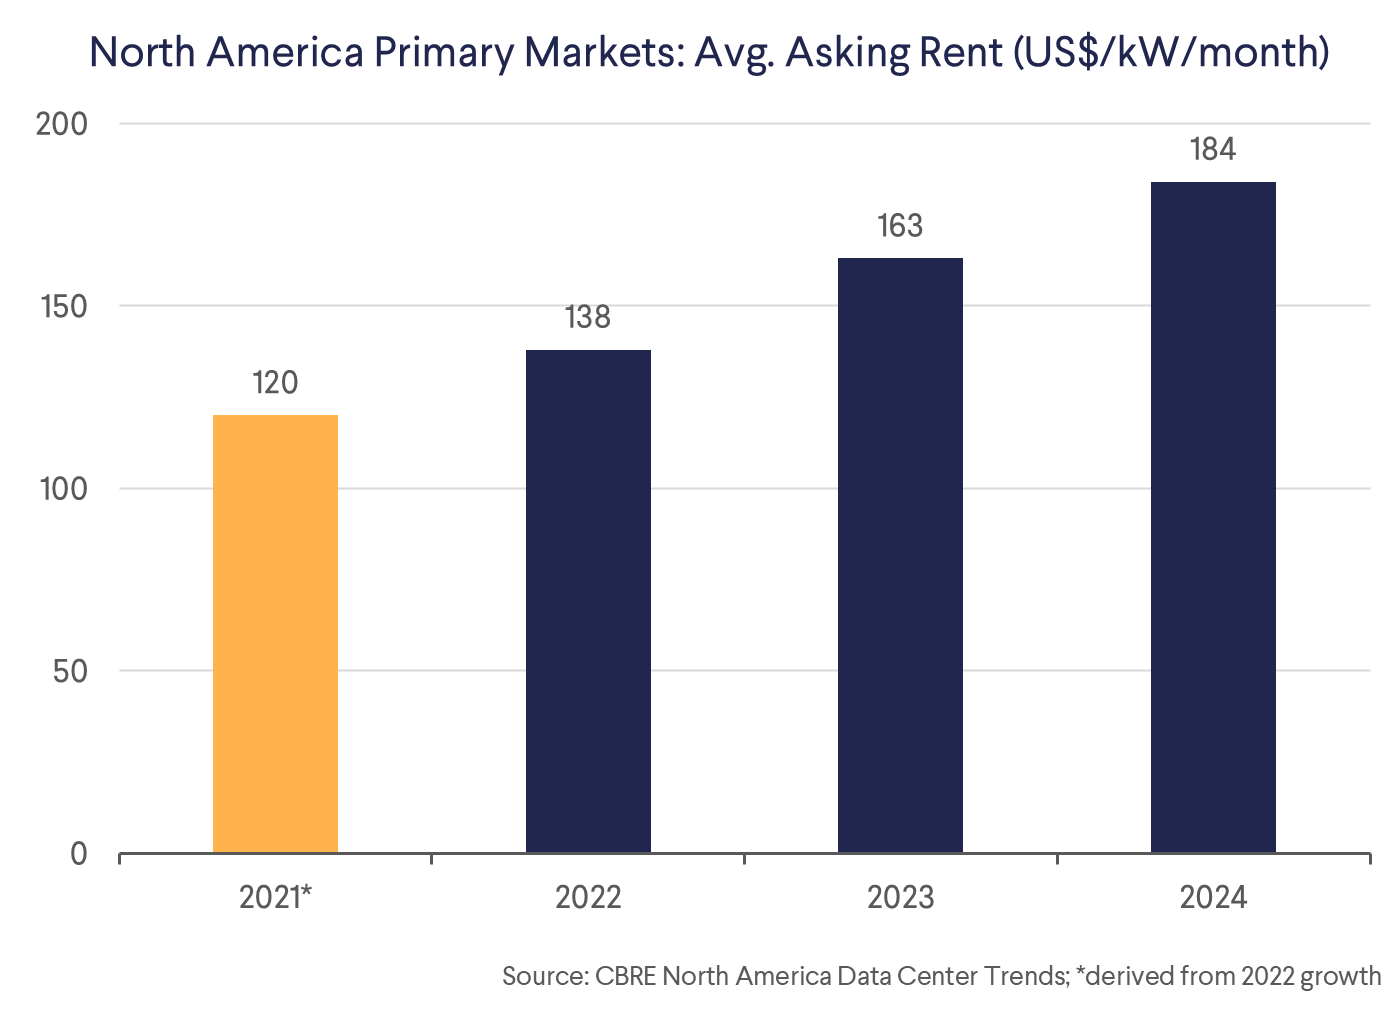
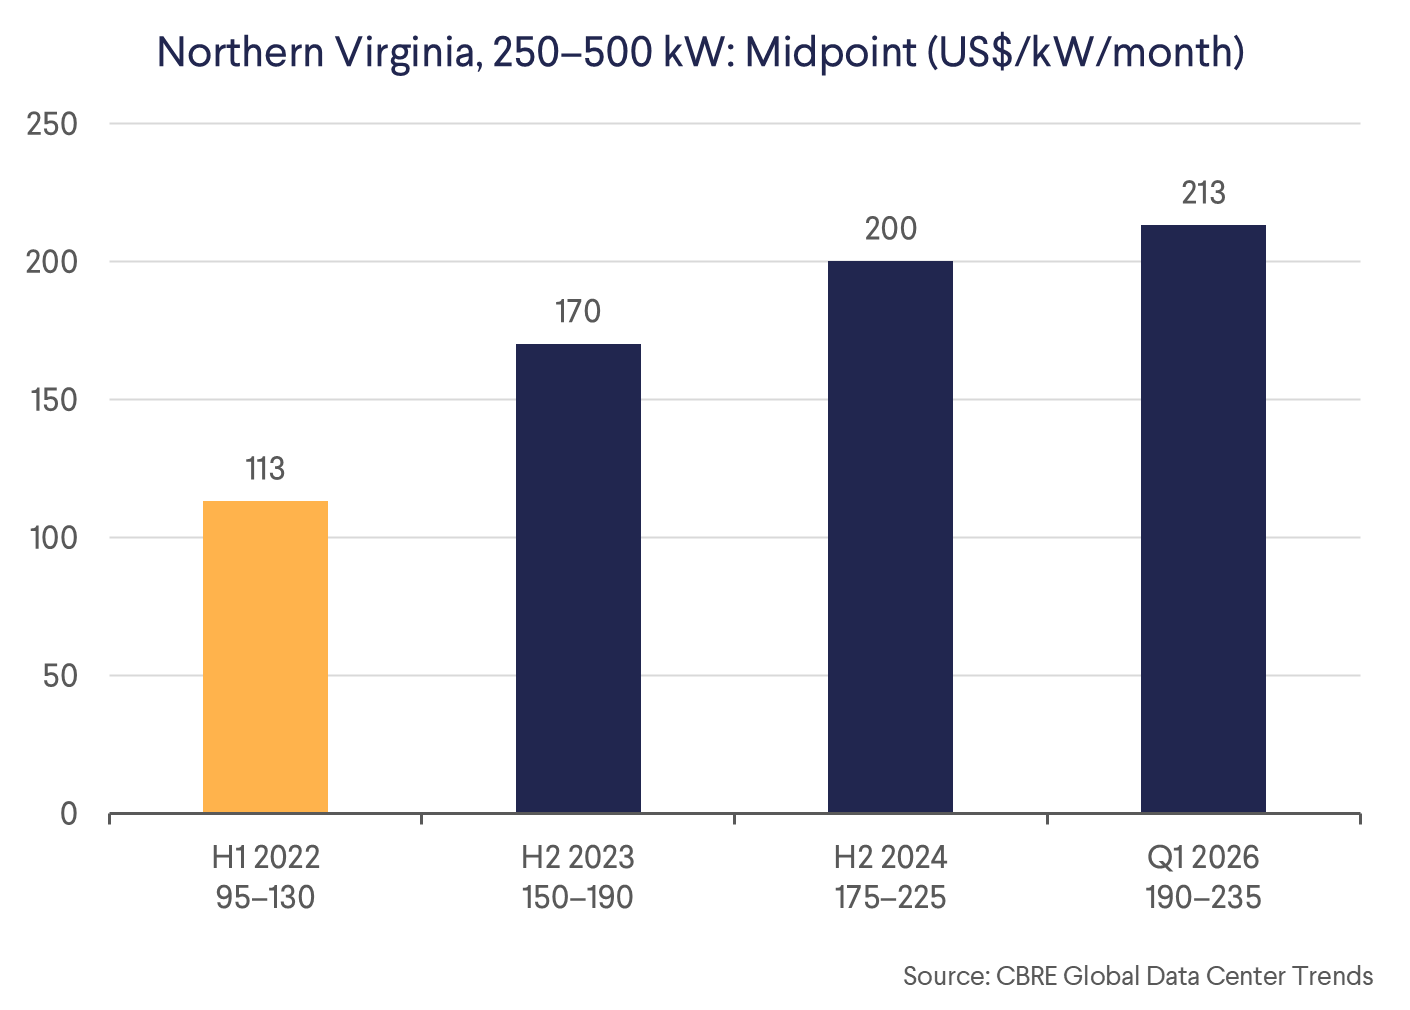
The US followed the same path. Average asking rents across North American primary markets had not risen since 2017. Once power ran short, they compounded, from USD 120/kW/month in 2021 to USD 184 in 2024. In Northern Virginia, the midpoint asking rent for 250-500kW deployments rose 89%, from USD 113/kW/month in 1H22 to USD 213 in 1Q26. Vacancy in 1H26 was 0.2%, effectively no space left to lease.
The Constraint Is Spreading
In the US, 104 moratorium actions have been taken across 26 states. Loudoun County is weighing a pause on all new applications, Oregon has paused permits until July 2027, and the overflow markets are closing too, with restrictions in Milwaukee, San Diego and Aurora. In Australia, Victoria now requires self-supplied renewables, no use of drinking water and 150m buffers, with mandatory national standards due in early 2027. Goodman (GMG) withdrew its 90MW Project Mars, and NextDC's M3 grid works are halted until February 2027. In Japan, super-high-voltage connections in Greater Tokyo face waits of more than five years, the TEPCO queue exceeds 36 months for 10MW+ connections, residents are suing over a new facility in Inzai, and protests have taken place in Hino and Shiroi.
The closing of these relief-valve markets matters most. It is the condition that turned Singapore's cap into a lasting premium rather than a Dublin-style exodus.
NextDC is the cautionary tale. Shares fell 41.7% after the company cut FY27 EBITDA guidance by 36% on October 21st, as grid supply to M3 slipped to FY28. Like-for-like capex was cut by c.AUD 980m, or roughly 18%, and new projects and land purchases have been frozen. Across the National Electricity Market, roughly a third of proposed projects were cancelled within a year. Yet the demand is still there. M3 capacity remains contracted to customers, Melbourne vacancy is below 2%, and tenants have signed but cannot get power. Developers bear the cost of the constraint; owners of powered, operating capacity capture it.
Why Owners Capture the Value
Power, not land or buildings, is now the binding input. We see four reasons why the value accrues to incumbents. Firstly, powered megawatts are scarce, so vacancy falls and asking rents rise. Secondly, replacement cost rises: self-supplied power, buffers, water limits and undergrounded lines raise the cost of every new megawatt, which sets the floor for market rent. Thirdly, incumbency is protected, as new rules are not retrospective and existing powered assets escape the costs every new entrant must bear. Fourthly, the pipeline is unreliable. Approved, contracted projects stall at the grid, and signed but unserved demand becomes bargaining power for landlords.
Three moats keep tier-one demand in place. Interconnection (cables, exchanges and cloud on-ramps) binds at the metro level and is the strongest; it held Singapore's premium even with Johor next door. Data sovereignty binds at the country level and is strong for offshore alternatives; Australia's certified hosting regime keeps government data onshore. Latency is the weakest of the three. The physics floor for a fibre round trip is under 1ms between Singapore and Johor, 5ms between Tokyo and Osaka, 10ms between Sydney and Melbourne and 11ms between Northern Virginia and Atlanta. 64% of firms need only sub-250ms latency for their main AI uses, which can be met anywhere in-country. The truly metro-bound tier, at c.20ms, covers voice and agentic AI, trading and cloud on-ramps. With inference expected to rise from 26% to 42% of AI workloads by 2030, latency is a rising factor, but it supports the case rather than leads it. The rent benefit is largest where the supply constraint binds at the same scale as the moat: city-level for interconnection, national for sovereignty.
Accordingly, the winners are owners of powered, operating capacity in Northern Virginia core, Singapore, Tokyo and Melbourne, particularly where leases signed before 2023 roll in 2027-29 at below-market rents, as well as interconnection hubs, holders of secured grid allocations and sites that can densify for AI inference. The losers are developers with unpowered pipelines, projects near homes and schools, legacy halls built for 5-15kW per rack, developers in overflow markets now imposing moratoria, and owners where supply is still loosening, such as Osaka. Hyperscalers and enterprise tenants pay through higher rents, longer waits for power and less choice of location. Fully leased new assets also benefit, but later, through terminal value and renewals rather than near-term income. Where demand can move next door, as in Dublin and Amsterdam, there is no premium.
Where Supply Will Be Tightest
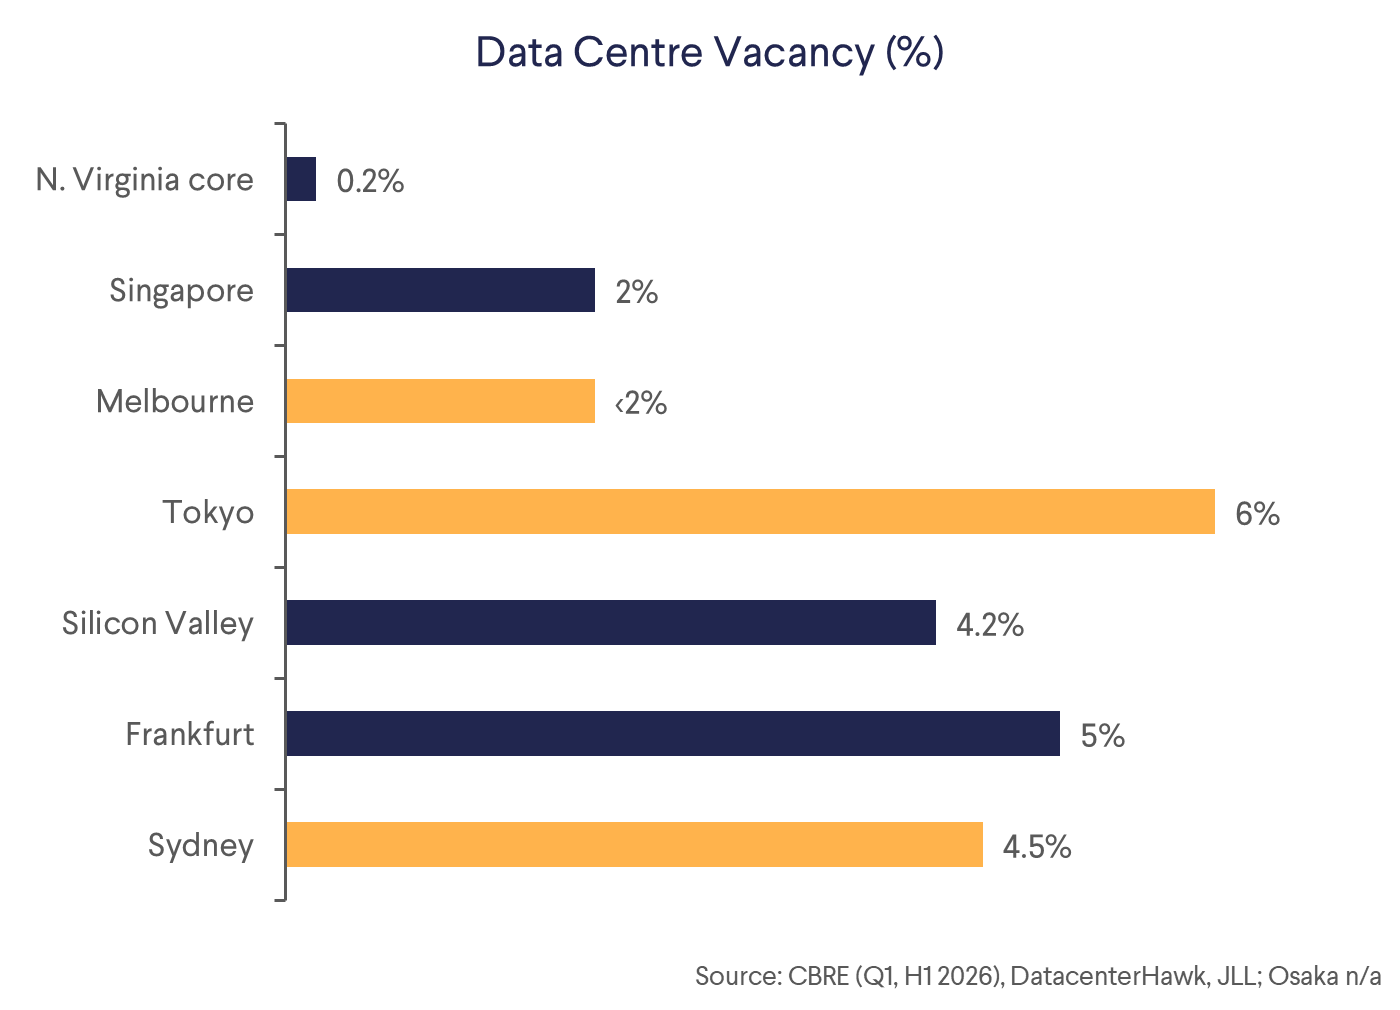
Northern Virginia core (0.2% vacancy) and Singapore (2%) are very tight. By-right building has ended in Northern Virginia, and while 2.4GW is under way, a pause is pending; Singapore's allocations are rationed and availability is fragmented. Melbourne (below 2%) and Tokyo (6%) are tightening into 2027-29. Tokyo has 2.5GW planned against 1.1GW of stock, but grid waits of more than five years hold the pipeline back. Silicon Valley adds only c.34MW a year and Frankfurt's grid waits run 24-36 months. Sydney's pipeline remains largely intact, though national rules from 2027 will firm the market. Osaka is the exception, with capacity projected to grow c.170%, so a re-rating is unlikely in the near term.
| Market | Supply outlook | Verdict |
|---|---|---|
| N. Virginia core | 2.4GW under way, but by-right ended; pause pending | Very tight |
| Singapore | Rationed allocations; fragmented availability | Very tight |
| Melbourne | Victorian rules; M3 grid supply slips to FY28 | Tightening |
| Tokyo | 2.5GW planned vs. 1.1GW stock; grid waits 5+ years | Tightening |
| Silicon Valley | c.34MW a year; demand leaking to other markets | Tight |
| Frankfurt | +23% a year, but grid waits 24-36 months | Tight in core |
| Sydney | Pipeline largely intact; national rules from 2027 | Moderate, firming |
| Osaka | Capacity projected +170% | Loosening |
Source: CBRE, JLL, NextDC; verdicts B&I Capital
The largest rent gaps are in Tokyo, at USD 280/kW/month, and Sydney and Melbourne, at USD 188, vs. USD 403 in Singapore. With Atlanta, Phoenix, Osaka and Melbourne tightening too, demand has fewer places to leak to, and we see a re-rating as likely in Tokyo and the widest gap in Australia.
S-REIT Exposure
Source: Keppel DC REIT 1H26, Digital Core REIT Oct 2026, NTT DC REIT Sep 2026; B&I Capital
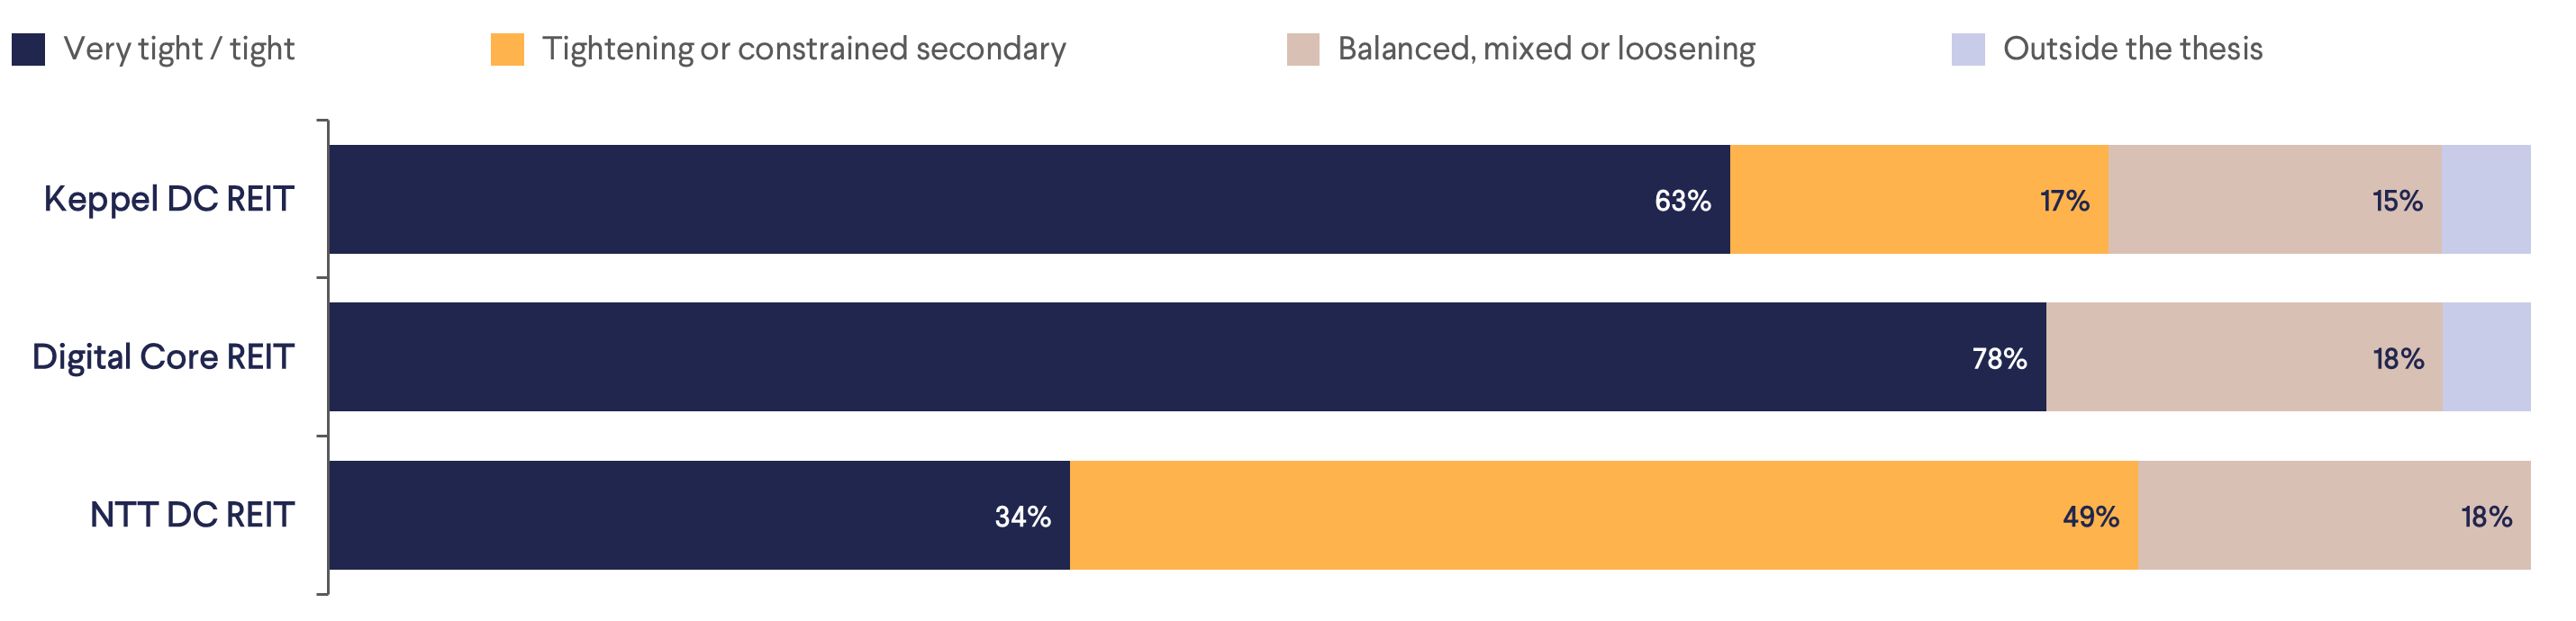
Keppel DC REIT (AJBU) is the most direct beneficiary. 63% of AUM is in Singapore, the precedent market. Colocation accounts for 74% of rental income on a 2.8-year WALE, so it rolls to market quickly, and 62% of rental income expires in 2028-30. Rental reversion was +45% in FY25, and renewal rents at Gore Hill in Sydney more than doubled. The limits are that reversion slowed to c.10% in 1H26 (2Q c.5%) after the large renewals, Keppel DC Singapore 1 is only 46.5% occupied, a test of legacy specification, the top hyperscaler accounts for 43.5% of rental income, and Europe (15%) and China (4%) sit outside the thesis. The key test is whether the 2028-30 Singapore renewals repeat the FY25 step-up.
Digital Core REIT (DCRU) owns the right metros, but captures the scarcity more slowly. Pro forma for the August 12th transaction, c.78% of AUM sits in constrained tier-one metros: Northern Virginia 34%, Frankfurt 26%, Silicon Valley 14% and Singapore 4%. Cash rental reversion was +25% in 1H26, with Linton Hall re-let at +35%, and the REIT trades at a 46% discount to NAV with an 8.5% DPU yield. However, the portfolio is hyperscale-heavy with a 5.2-year WALE, so gains come through renewals and valuations over time, and 2027 guidance is only for positive mid-single-digit cash reversion. The top customer accounts for 33% of rent, and Osaka rising to 18% is the one exposure that cuts against the thesis.
NTT DC REIT (NTDU) is a partial beneficiary. Singapore's SG1 (19% of valuation) has a 1.9-year WALE, offering near-term reversion, and the NTT MSA renewed at +23%. VA2 in Northern Virginia (15%) is 98% occupied in a market with c.1% vacancy, and committed occupancy across the portfolio is 99.2%, with rental reversion of +13.4% in 1Q FY26/27. Only c.34% of the portfolio sits in the tightest tier-one markets, however. Sacramento (49%) has seen supply flat at c.96MW since 2021, but it is a secondary market with rents of USD 150-220/kW/month vs. USD 200-275 in Silicon Valley. Vienna (18%) is balanced at c.8% vacancy and dilutes the exposure.
Risks and Catalysts
Demand is the real risk. A constraint without demand gives flat rents, as in Sydney today. The common objections are less convincing. Dublin and Amsterdam had moratoria and no premium, but demand moved within the same zone; the thesis requires the substitute to close too. Supply is still growing fast, but much of it is grandfathered and NextDC's M3 shows it may not get power on time. Singapore rents plateaued, which is what we expect: a step change, then a plateau, not perpetual growth. Behind-the-meter power could bypass the grid in time, but it raises the cost of new supply, which supports incumbent rents. Retrospective rules remain a tail risk for incumbents; councils have asked, but no state has enacted them.
The catalysts to watch are NextDC's capex review at its AGM on November 20th, which will size the cut to the Australian pipeline, and the New York governor's decision on the data center bill by year-end, which would be the first large-state restriction. In January 2027, the Virginia legislative session and the Loudoun application pause will test the core of the largest market. February 2027 is the earliest restart of Jemena's M3 grid works, a test of whether approved supply can get power, and the Australian national standards are due to be legislated in early 2027, which will show whether rules reach existing assets. Oregon's permit pause ends on July 1st, 2027; an extension would signal that the constraint persists.
Conclusion
Own powered, operating capacity where the substitute is also closing. We have high confidence that supply caps raise rents where substitutes are also constrained, as Singapore and Northern Virginia have shown. We have moderate confidence that Tokyo, Northern Virginia core, and Sydney and Melbourne will follow, most visibly in 2027-29, and low confidence on the size of the move outside those markets. Among S-REITs, Keppel DC REIT has the most direct exposure, followed by Digital Core REIT and NTT DC REIT.
Download the PDF version of the presentation here